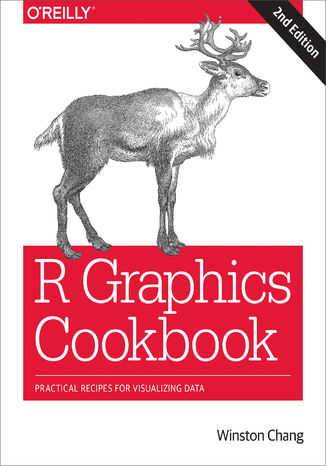
R Graphics Cookbook. Practical Recipes for Visualizing Data. 2nd Edition Winston Chang


- Autor:
- Winston Chang
- Wydawnictwo:
- O'Reilly Media
- Ocena:
- Stron:
- 444
- Dostępne formaty:
-
ePubMobi
Opis
książki
:
R Graphics Cookbook. Practical Recipes for Visualizing Data. 2nd Edition
This O’Reilly cookbook provides more than 150 recipes to help scientists, engineers, programmers, and data analysts generate high-quality graphs quickly—without having to comb through all the details of R’s graphing systems. Each recipe tackles a specific problem with a solution you can apply to your own project and includes a discussion of how and why the recipe works.
Most of the recipes in this second edition use the updated version of the ggplot2 package, a powerful and flexible way to make graphs in R. You’ll also find expanded content about the visual design of graphics. If you have at least a basic understanding of the R language, you’re ready to get started with this easy-to-use reference.
- Use R’s default graphics for quick exploration of data
- Create a variety of bar graphs, line graphs, and scatter plots
- Summarize data distributions with histograms, density curves, box plots, and more
- Provide annotations to help viewers interpret data
- Control the overall appearance of graphics
- Explore options for using colors in plots
- Create network graphs, heat maps, and 3D scatter plots
- Get your data into shape using packages from the tidyverse
Wybrane bestsellery
O'Reilly Media - inne książki
Dzięki opcji "Druk na żądanie" do sprzedaży wracają tytuły Grupy Helion, które cieszyły sie dużym zainteresowaniem, a których nakład został wyprzedany.
Dla naszych Czytelników wydrukowaliśmy dodatkową pulę egzemplarzy w technice druku cyfrowego.
Co powinieneś wiedzieć o usłudze "Druk na żądanie":
- usługa obejmuje tylko widoczną poniżej listę tytułów, którą na bieżąco aktualizujemy;
- cena książki może być wyższa od początkowej ceny detalicznej, co jest spowodowane kosztami druku cyfrowego (wyższymi niż koszty tradycyjnego druku offsetowego). Obowiązująca cena jest zawsze podawana na stronie WWW książki;
- zawartość książki wraz z dodatkami (płyta CD, DVD) odpowiada jej pierwotnemu wydaniu i jest w pełni komplementarna;
- usługa nie obejmuje książek w kolorze.
Masz pytanie o konkretny tytuł? Napisz do nas: sklep@helion.pl
Książka drukowana












Oceny i opinie klientów: R Graphics Cookbook. Practical Recipes for Visualizing Data. 2nd Edition Winston Chang
(0)