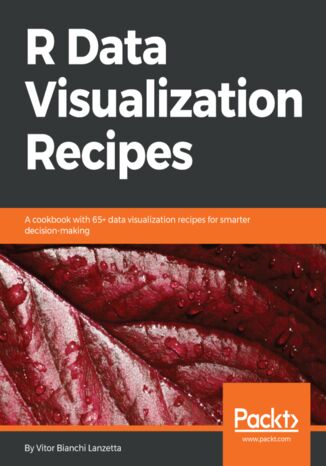
R Data Visualization Recipes. A cookbook with 65+ data visualization recipes for smarter decision-making Vitor Bianchi Lanzetta


- Autor:
- Vitor Bianchi Lanzetta
- Wydawnictwo:
- Packt Publishing
- Ocena:
- Stron:
- 366
- Dostępne formaty:
-
PDFePubMobi
Opis
książki
:
R Data Visualization Recipes. A cookbook with 65+ data visualization recipes for smarter decision-making
This book is an update to our earlier R data visualization cookbook with 100 percent fresh content and covering all the cutting edge R data visualization tools. This book is packed with practical recipes, designed to provide you with all the guidance needed to get to grips with data visualization using R. It starts off with the basics of ggplot2, ggvis, and plotly visualization packages, along with an introduction to creating maps and customizing them, before progressively taking you through various ggplot2 extensions, such as ggforce, ggrepel, and gganimate. Using real-world datasets, you will analyze and visualize your data as histograms, bar graphs, and scatterplots, and customize your plots with various themes and coloring options. The book also covers advanced visualization aspects such as creating interactive dashboards using Shiny
By the end of the book, you will be equipped with key techniques to create impressive data visualizations with professional efficiency and precision.
Wybrane bestsellery
Packt Publishing - inne książki
Dzięki opcji "Druk na żądanie" do sprzedaży wracają tytuły Grupy Helion, które cieszyły sie dużym zainteresowaniem, a których nakład został wyprzedany.
Dla naszych Czytelników wydrukowaliśmy dodatkową pulę egzemplarzy w technice druku cyfrowego.
Co powinieneś wiedzieć o usłudze "Druk na żądanie":
- usługa obejmuje tylko widoczną poniżej listę tytułów, którą na bieżąco aktualizujemy;
- cena książki może być wyższa od początkowej ceny detalicznej, co jest spowodowane kosztami druku cyfrowego (wyższymi niż koszty tradycyjnego druku offsetowego). Obowiązująca cena jest zawsze podawana na stronie WWW książki;
- zawartość książki wraz z dodatkami (płyta CD, DVD) odpowiada jej pierwotnemu wydaniu i jest w pełni komplementarna;
- usługa nie obejmuje książek w kolorze.
Masz pytanie o konkretny tytuł? Napisz do nas: sklep@helion.pl
Książka drukowana














Oceny i opinie klientów: R Data Visualization Recipes. A cookbook with 65+ data visualization recipes for smarter decision-making Vitor Bianchi Lanzetta
(0)