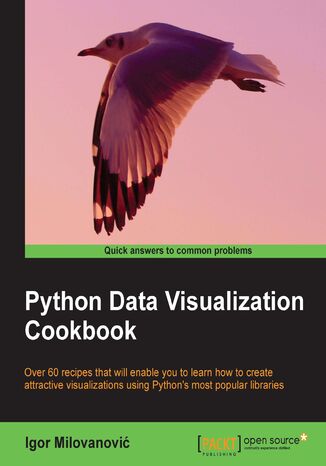
Python Data Visualization Cookbook. As a developer with knowledge of Python you are already in a great position to start using data visualization. This superb cookbook shows you how in plain language and practical recipes, culminating with 3D animations Igor Milovanovic


- Autor:
- Igor Milovanovic
- Wydawnictwo:
- Packt Publishing
- Ocena:
- Stron:
- 280
- Dostępne formaty:
-
PDFePubMobi
Opis
książki
:
Python Data Visualization Cookbook. As a developer with knowledge of Python you are already in a great position to start using data visualization. This superb cookbook shows you how in plain language and practical recipes, culminating with 3D animations
Python Data Visualization Cookbook will progress the reader from the point of installing and setting up a Python environment for data manipulation and visualization all the way to 3D animations using Python libraries. Readers will benefit from over 60 precise and reproducible recipes that guide the reader towards a better understanding of data concepts and the building blocks for subsequent and sometimes more advanced concepts.
Python Data Visualization Cookbook starts by showing you how to set up matplotlib and the related libraries that are required for most parts of the book, before moving on to discuss some of the lesser-used diagrams and charts such as Gantt Charts or Sankey diagrams. During the book, we go from simple plots and charts to more advanced ones, thoroughly explaining why we used them and how not to use them. As we go through the book, we will also discuss 3D diagrams. We will peep into animations just to show you what it takes to go into that area. Maps are irreplaceable for displaying geo-spatial data, so we also show you how to build them. In the last chapter, we show you how to incorporate matplotlib into different environments, such as a writing system, LaTeX, or how to create Gantt charts using Python.
This book will help those who already know how to program in Python to explore a new field – one of data visualization. As this book is all about recipes that explain how to do something, code samples are abundant, and they are followed by visual diagrams and charts to help you understand the logic and compare your own results with what is explained in the book.
Wybrane bestsellery
Packt Publishing - inne książki
Dzięki opcji "Druk na żądanie" do sprzedaży wracają tytuły Grupy Helion, które cieszyły sie dużym zainteresowaniem, a których nakład został wyprzedany.
Dla naszych Czytelników wydrukowaliśmy dodatkową pulę egzemplarzy w technice druku cyfrowego.
Co powinieneś wiedzieć o usłudze "Druk na żądanie":
- usługa obejmuje tylko widoczną poniżej listę tytułów, którą na bieżąco aktualizujemy;
- cena książki może być wyższa od początkowej ceny detalicznej, co jest spowodowane kosztami druku cyfrowego (wyższymi niż koszty tradycyjnego druku offsetowego). Obowiązująca cena jest zawsze podawana na stronie WWW książki;
- zawartość książki wraz z dodatkami (płyta CD, DVD) odpowiada jej pierwotnemu wydaniu i jest w pełni komplementarna;
- usługa nie obejmuje książek w kolorze.
Masz pytanie o konkretny tytuł? Napisz do nas: sklep@helion.pl
Książka drukowana












Oceny i opinie klientów: Python Data Visualization Cookbook. As a developer with knowledge of Python you are already in a great position to start using data visualization. This superb cookbook shows you how in plain language and practical recipes, culminating with 3D animations Igor Milovanovic
(0)