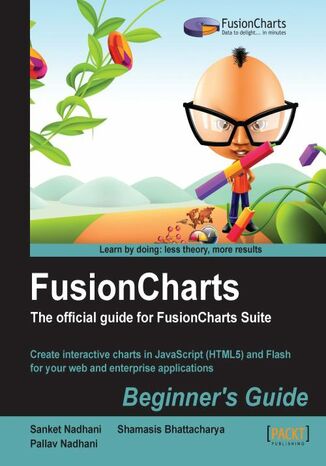
FusionCharts Beginner's Guide: The Official Guide for FusionCharts Suite. Create interactive charts in JavaScript (HTML5) and Flash for your web and enterprise applications with this book and Sanket Nadhani, Pallav Nadhani, Shamasis Bhattacharya


- Autorzy:
- Sanket Nadhani, Pallav Nadhani, Shamasis Bhattacharya
- Wydawnictwo:
- Packt Publishing
- Ocena:
- Stron:
- 252
- Dostępne formaty:
-
PDFePubMobi
Opis
książki
:
FusionCharts Beginner's Guide: The Official Guide for FusionCharts Suite. Create interactive charts in JavaScript (HTML5) and Flash for your web and enterprise applications with this book and
FusionCharts Beginner's Guide is a practical, step-by-step guide to using FusionCharts Suite for creating delightful web reports and dashboards. Getting you started quickly, you will learn advanced reporting capabilities like drill-down and JavaScript integration, and charting best practices to make the most out of it. Filled with examples, real-life tips and challenges, this book is the firstofitstype in the visualization industry.
The book teaches you to create delightful reports and dashboards for your web applications assuming no previous knowledge of FusionCharts Suite. It gets your first chart up in 15 minutes after which you can play around with different chart types and customize them. You will also learn how to create a powerful reporting experience using drill-down and advanced JavaScript capabilities. You will also connect your charts to server-side scripts pulling data from databases. Finally you round up the experience learning reporting best practices including right chart type selection and practical usability tips.
By the end of the book, you will have a solid foundation in FusionCharts Suite and data visualization itself. You will be able to give your users a delightful reporting experience, from developers to management alike.
Wybrane bestsellery
Packt Publishing - inne książki
Dzięki opcji "Druk na żądanie" do sprzedaży wracają tytuły Grupy Helion, które cieszyły sie dużym zainteresowaniem, a których nakład został wyprzedany.
Dla naszych Czytelników wydrukowaliśmy dodatkową pulę egzemplarzy w technice druku cyfrowego.
Co powinieneś wiedzieć o usłudze "Druk na żądanie":
- usługa obejmuje tylko widoczną poniżej listę tytułów, którą na bieżąco aktualizujemy;
- cena książki może być wyższa od początkowej ceny detalicznej, co jest spowodowane kosztami druku cyfrowego (wyższymi niż koszty tradycyjnego druku offsetowego). Obowiązująca cena jest zawsze podawana na stronie WWW książki;
- zawartość książki wraz z dodatkami (płyta CD, DVD) odpowiada jej pierwotnemu wydaniu i jest w pełni komplementarna;
- usługa nie obejmuje książek w kolorze.
Masz pytanie o konkretny tytuł? Napisz do nas: sklep@helion.pl
Książka drukowana
















Oceny i opinie klientów: FusionCharts Beginner's Guide: The Official Guide for FusionCharts Suite. Create interactive charts in JavaScript (HTML5) and Flash for your web and enterprise applications with this book and Sanket Nadhani, Pallav Nadhani, Shamasis Bhattacharya
(0)