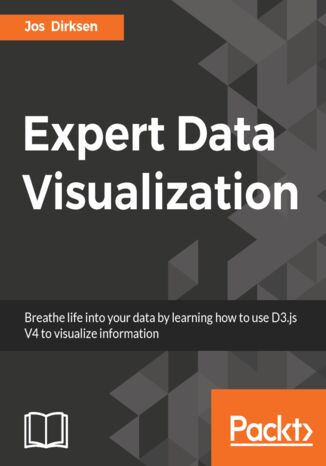
Expert Data Visualization. Advanced information visualization with D3.js 4.x Jos Dirksen


- Autor:
- Jos Dirksen
- Wydawnictwo:
- Packt Publishing
- Ocena:
- Stron:
- 394
- Dostępne formaty:
-
PDFePubMobi
Opis
książki
:
Expert Data Visualization. Advanced information visualization with D3.js 4.x
The book includes a number of extensive examples that to help you hone your skills with data visualization. Throughout nine chapters these examples will help you acquire a clear practical understanding of the various techniques, tools and functionality provided by D3.js. You will first setup your D3.JS development environment and learn the basic patterns needed to visualize your data. After that you will learn techniques to optimize different processes such as working with selections; animating data transitions; creating graps and charts, integrating external resources (static as well as streaming); visualizing information on maps; working with colors and scales; utilizing the different D3.js APIs; and much more. The book will also guide you through creating custom graphs and visualizations, and show you how to go from the raw data to beautiful visualizations. The extensive examples will include working with complex and realtime data streams, such as seismic data, geospatial data, scientific data, and more. Towards the end of the book, you will learn to add more functionality on top of D3.js by using it with other external libraries and integrating it with Ecmascript 6 and Typescript
Wybrane bestsellery
Jos Dirksen - pozostałe książki
Packt Publishing - inne książki
Dzięki opcji "Druk na żądanie" do sprzedaży wracają tytuły Grupy Helion, które cieszyły sie dużym zainteresowaniem, a których nakład został wyprzedany.
Dla naszych Czytelników wydrukowaliśmy dodatkową pulę egzemplarzy w technice druku cyfrowego.
Co powinieneś wiedzieć o usłudze "Druk na żądanie":
- usługa obejmuje tylko widoczną poniżej listę tytułów, którą na bieżąco aktualizujemy;
- cena książki może być wyższa od początkowej ceny detalicznej, co jest spowodowane kosztami druku cyfrowego (wyższymi niż koszty tradycyjnego druku offsetowego). Obowiązująca cena jest zawsze podawana na stronie WWW książki;
- zawartość książki wraz z dodatkami (płyta CD, DVD) odpowiada jej pierwotnemu wydaniu i jest w pełni komplementarna;
- usługa nie obejmuje książek w kolorze.
Masz pytanie o konkretny tytuł? Napisz do nas: sklep@helion.pl
Książka drukowana















Oceny i opinie klientów: Expert Data Visualization. Advanced information visualization with D3.js 4.x Jos Dirksen
(0)