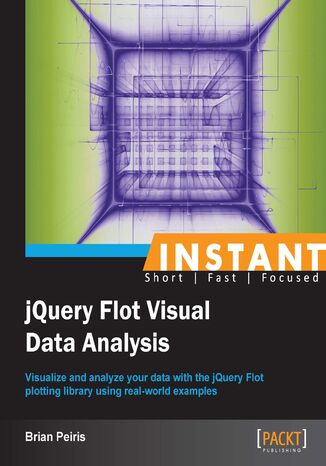
Instant jQuery Flot Visual Data Analysis. Visualize and analyze your data with the jQuery Flot plotting library using real-world examples Brian Peiris


- Autor:
- Brian Peiris
- Wydawnictwo:
- Packt Publishing
- Ocena:
- Stron:
- 70
- Dostępne formaty:
-
PDFePubMobi
Opis
książki
:
Instant jQuery Flot Visual Data Analysis. Visualize and analyze your data with the jQuery Flot plotting library using real-world examples
A practical guide to take you through the basics of using Flot to visualize your data; the book describes Flot's functionality in dedicated sections that include code, screenshots, and detailed explanations so that you can learn to produce charts in minutes. As you progress though this book, it will guide you through real-world examples to show you how to use statistical techniques with Flot for interactive data visualization and analysis.
Starting with the very basics, you will learn exactly what you need to do to display the simplest chart using Flot. This step-by-step guide takes you through Flot's many features and settings until you can finally master the techniques you'll need to apply Flot to your application's data.
You'll learn to create basic point, line, and bar charts and to use Flot's stack, pie, and time plugins to create specialized chart types. Along with learning to display complex data with multiple customizable axes you will learn to make your charts interactive with Flot's crosshair plugin. Finally, this book will guide you through learning statistical techniques via the jStat JavaScript library to analyse data; along with Flot's errorbars and fillbetween plugins to display error margins and data percentiles.
Instant jQuery Flot Visual Data Analysis will give you a head start so that you can add data visualization features to your applications with ease.
Wybrane bestsellery
Packt Publishing - inne książki
Dzięki opcji "Druk na żądanie" do sprzedaży wracają tytuły Grupy Helion, które cieszyły sie dużym zainteresowaniem, a których nakład został wyprzedany.
Dla naszych Czytelników wydrukowaliśmy dodatkową pulę egzemplarzy w technice druku cyfrowego.
Co powinieneś wiedzieć o usłudze "Druk na żądanie":
- usługa obejmuje tylko widoczną poniżej listę tytułów, którą na bieżąco aktualizujemy;
- cena książki może być wyższa od początkowej ceny detalicznej, co jest spowodowane kosztami druku cyfrowego (wyższymi niż koszty tradycyjnego druku offsetowego). Obowiązująca cena jest zawsze podawana na stronie WWW książki;
- zawartość książki wraz z dodatkami (płyta CD, DVD) odpowiada jej pierwotnemu wydaniu i jest w pełni komplementarna;
- usługa nie obejmuje książek w kolorze.
Masz pytanie o konkretny tytuł? Napisz do nas: sklep@helion.pl
Książka drukowana





















Oceny i opinie klientów: Instant jQuery Flot Visual Data Analysis. Visualize and analyze your data with the jQuery Flot plotting library using real-world examples Brian Peiris
(0)