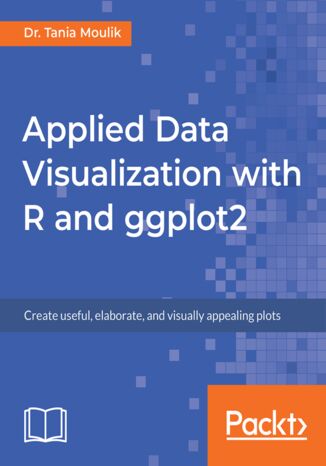
Applied Data Visualization with R and ggplot2. Create useful, elaborate, and visually appealing plots Dr. Tania Moulik


- Autor:
- Dr. Tania Moulik
- Wydawnictwo:
- Packt Publishing
- Ocena:
- Stron:
- 140
- Dostępne formaty:
-
PDFePubMobi
Opis
książki
:
Applied Data Visualization with R and ggplot2. Create useful, elaborate, and visually appealing plots
You’ll discover what layers, scales, coordinates, and themes are, and study how you can use them to transform your data into aesthetical graphs. Once you’ve grasped the basics, you’ll move on to studying simple plots such as histograms and advanced plots such as superimposing and density plots. You’ll also get to grips with plotting trends, correlations, and statistical summaries.
By the end of this book, you’ll have created data visualizations that will impress your clients.
Wybrane bestsellery
Packt Publishing - inne książki
Dzięki opcji "Druk na żądanie" do sprzedaży wracają tytuły Grupy Helion, które cieszyły sie dużym zainteresowaniem, a których nakład został wyprzedany.
Dla naszych Czytelników wydrukowaliśmy dodatkową pulę egzemplarzy w technice druku cyfrowego.
Co powinieneś wiedzieć o usłudze "Druk na żądanie":
- usługa obejmuje tylko widoczną poniżej listę tytułów, którą na bieżąco aktualizujemy;
- cena książki może być wyższa od początkowej ceny detalicznej, co jest spowodowane kosztami druku cyfrowego (wyższymi niż koszty tradycyjnego druku offsetowego). Obowiązująca cena jest zawsze podawana na stronie WWW książki;
- zawartość książki wraz z dodatkami (płyta CD, DVD) odpowiada jej pierwotnemu wydaniu i jest w pełni komplementarna;
- usługa nie obejmuje książek w kolorze.
Masz pytanie o konkretny tytuł? Napisz do nas: sklep@helion.pl
Książka drukowana

















Oceny i opinie klientów: Applied Data Visualization with R and ggplot2. Create useful, elaborate, and visually appealing plots Dr. Tania Moulik
(0)